· Brittany Ellich · illustration · 1 min read
The social media coolness curve
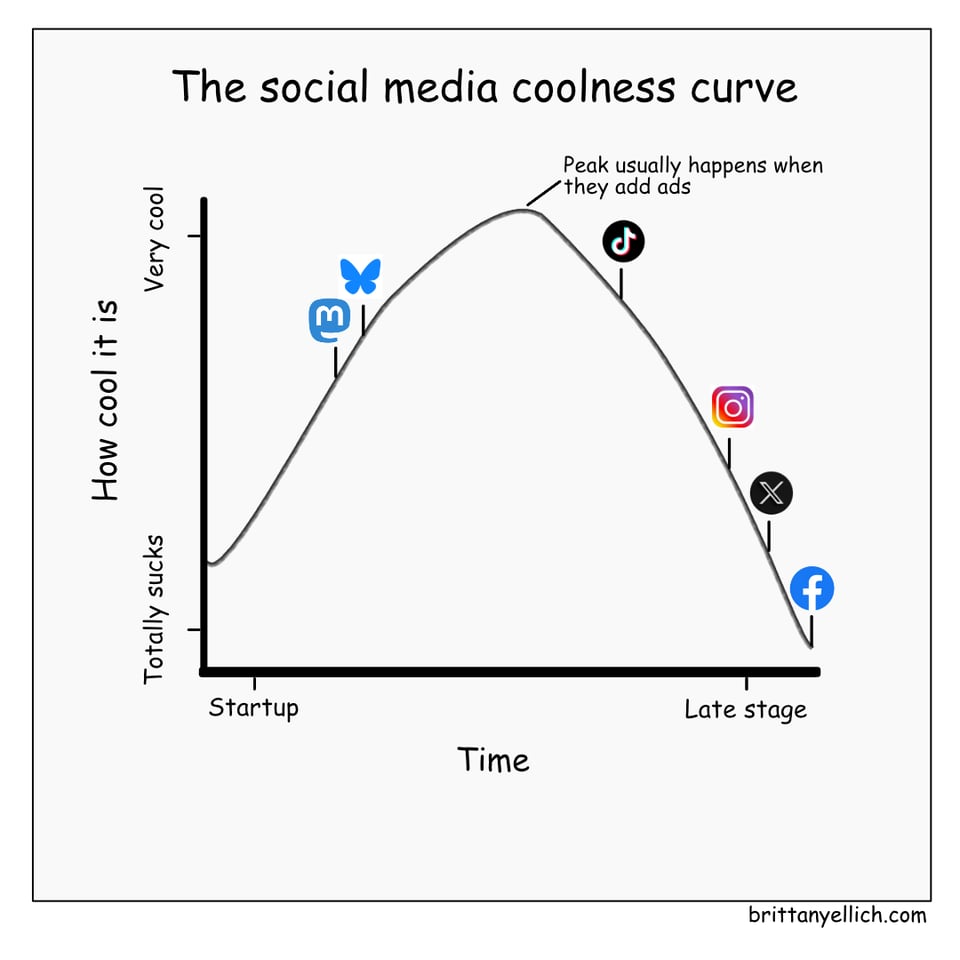
I have stayed out of social media for a long time. This is my perception of it as someone who is just getting back into it.
Share:
· Brittany Ellich · illustration · 1 min read
I have stayed out of social media for a long time. This is my perception of it as someone who is just getting back into it.
AI builds everything as this huge monster of too much, and now I feel like I’m iterating by trimming things back and perfecting it over time. It’s a bit like working from clay, and allowing the software underneath to expose itself in the…
For the last week or so I've had an agent working my task board. It picks up a task, writes the code in an isolated worktree, opens a PR, gets CI green, responds to review feedback, and parks the result somewhere I can test it. Then it…
Social media was supposed to connect us, but most of it has turned into ads, division, and loneliness. I'm betting on ATProto as a way to fix that, and not just for developers. Whether you're a scientist, journalist, or just someone who…
It seems like everyone is trying to make predictions right now. The discomfort of not knowing what the future holds is unbearable, and making a prediction (even a terrifying one) feels better than sitting in the ambiguity. When you can…